Civic Spark: Graduate-Level Design Project
I created a civic goal-tracking app prototype that combines social media, gamification, and real-world experiences. This was submitted for a course in the Information Design and Strategy program at Northwestern University.
Project timeframe: 6 months
Role: Graduate student
Tools: Figma, FigJam, Excel, Qualtrics
Artifacts shown: app screens, contextual inquiry photos, ideation, research results
Context & Problem
Create a mobile experience that increases community participation and civic engagement by leveraging best-practice research methods and state-of-the art UX strategies.
Problem statement
This project focused on increasing community engagement and participation for people who live in urban environments. Namely, it sought to address the following: (1) failing community engagement within US municipalities and (2) the loneliness epidemic. It did so in a novel way—by nudging users toward in-person community engagement. While past solutions might have focused on education, access to information, and participation in narrowly defined civic events, my solution focused on experiencing physical community as a means of enhancing and increasing community engagement.
Project framework and solution
I used a human-centered design (HCD) approach toward the solution, backed by both nudge theory and social-capital theory as conceptual frameworks. My entire project rests heavily on the research that I conducted on the user base, but most specifically on qualitative studies. From past experience and lessons on HCD approaches, it is most effective to draw heavily from qualitative research—the actual conversations, interviews, and observations of users, though I also conducted a rigorous round of quantitative research.
There are multiple behavioral and persuasive design techniques that were used throughout the prototype. These design patterns translate nudge theory by Richard Thaler and Cass Sunstein into actionable interactions that shape choices and habits and are systematically persuasive to change attitudes without coercion. The final project dissects each of these design patterns and explains how they were employed throughout. Ultimately, there is a choice architecture that structures the experience in such a way that desirable actions feel obviously next.
Next, the aim of all the work mentioned above is to increase social capital, which I employed to determine the main divisions within the app—namely the leisure, government, volunteering, and cultural components. Thus, social capital as a concept was broken down and distilled into four broad categories for the purposes of the application prototype. These four categories correspond with areas where users can find and participate in local community. They inform both the social posting and goal-tracking portions of the app, where users can see and show how they have increased their social capital via the categories mentioned above.

Research
I adopted the double-diamond design process to complete this project.
I employed both quantitative and qualitative methods to research the problem and help inform a solution. Qualitative research led the way, in which I interviewed and conducted contextual inquiries on a panel of five continuous participants over the course of three weeks within the project. Following the interviews, I conducted competitor analysis of multiple fitness, goal tracking, and educational apps that have a similar social or gamification aspect to the core feature set. The quantitative research flowed from the qualitative, and it involved multiple statistical analyses and use of descriptive statistics to qualify or reject hypotheses that I made from the qualitative data.
Qualitative Methods
I started with secondary research, where I read peer-reviewed literature on issues concerning social capital, civic engagement, and the UI patterns that I wanted to adopt. As part of the project, I produced a five-page literature review that spanned the conceptual and academic background of my research.
Interviews and contextual inquiry
After surveying the existing academic literature, I conducted a series of interviews with a panel of five participants who fit the primary demographics that my project was aimed toward. The first interviews focused on challenges and motivations for participating in community-based activities. I wanted to understand what deterred people from engaging with their community and what motivated some people to action. After gathering data from each participant in the first set of interviews, I compiled some ideas about how the solution might be created, and I went back to three of the participants and interviewed them once again about some of the ideas. They agreed with some of the direction and disagreed with other areas.
With the initial interviews completed, I conducted a contextual inquiry examination, where I asked participants to complete a task that I planned to cover in the app prototype. I wanted to get a good understanding of how people went about planning activities in the real world.

A contextual inquiry with coworkers.
From there, I was able to discern a set of core features that seemed to match what I gleaned in qualitative research. In order to put these assumptions to the test, I moved on to quantitative methods, where I ran actual statistical analysis to verify or refute my findings.
Quantitative Methods
To quantify the relationship between social-capital structures and civic behavior, I used the Opportunity Insights Social Capital Atlas file ‘Social Capital Data by County.’ The data set works by covering all US counties (N ≈ 3,100) and aggregates “21 billion anonymized Facebook friendships” in a single CSV file. This method allowed me to understand multiple dimensions of social capital (labelled here as bonding, bridging, and support) to compare cross-county experiences and understand how bridging and bonding elements impact likelihood to volunteer. I chose volunteering as the dependent variable because of availability of data and as a useful proxy for all the indicators of social capital that my solution aims to address. The two core independent variables, for bridging and bonding, use economic connectedness (the strongest variable I could find) and county support rates, respectively, based on Facebook data. Thus, my question was whether stronger community bridging and community bonding (as illustrated via proxy variables) lead to increased social capital (volunteering only in this case), as I suspected to be the case.
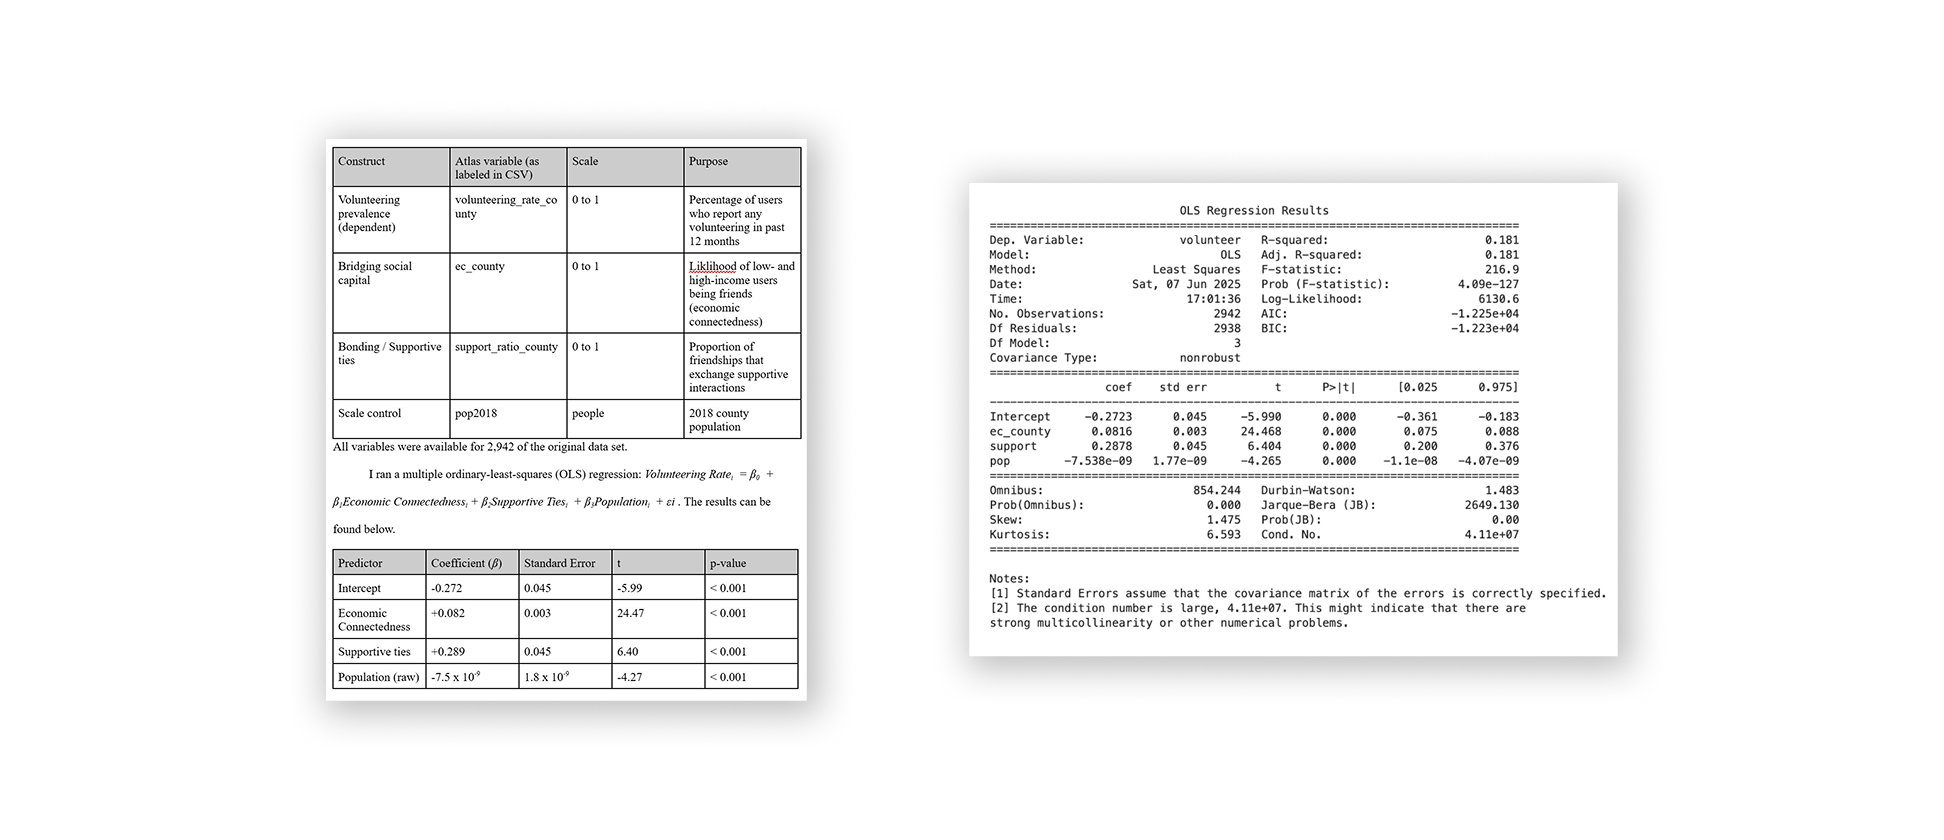
Quantitative results. An ordinary-least squares (OLS) regression to justify core app feature set and verify qualitative findings.
Upon interpretation, I found that bridging ties matter. Moving one county unit up the economic-connectedness predictor scale predicts an 8-point rise in share of residents who volunteer. That said, bonding and support is an even stronger indicator. A shift of 29 points is predicted for each unit increase of bonding and support within a community for volunteering as an outcome. Additionally, population seems to have little substantive impact. Although statistically significant, the effect of less than 1 point is negligible in the grand scheme.
These county-wide results mattered because they bolstered two findings I made during qualitative interviews—that strong “bridging” and “bonding” networks facilitate and encourage progress in the social capital in a community. Connections across socioeconomic lines perhaps facilitate resource sharing and so enhance exposure to volunteer opportunities. Additionally, emotionally supportive friendships also encourage and contribute to participation. Counties that rank high on both dimensions enjoy far higher volunteer rates, which can perhaps act as indicators for the other aspects of social capital that were implemented in the solution.
Drafting, Ideation, & Strategy
Based on the preliminary research findings and the stated goal of the project, I chose to create an app prototype as my core final deliverable. But before that, I created a set of user stories and guiding principals to help frame the development. The image below shows two images that I included in a slide-deck presentation, and they convey the concepts that I used. The first is nudge theory, which I used to help explain four ways to engage theory. The nudges I chose are sharing, social engagement, activity tracking, and goal tracking. Next, I evaluated the existing literature, my interviews, and the regression that I ran, and I chose four areas of focus for engaging with the community. They are volunteering, government participation, visiting parks and public recreational facilities, and supporting community cultural organizations.
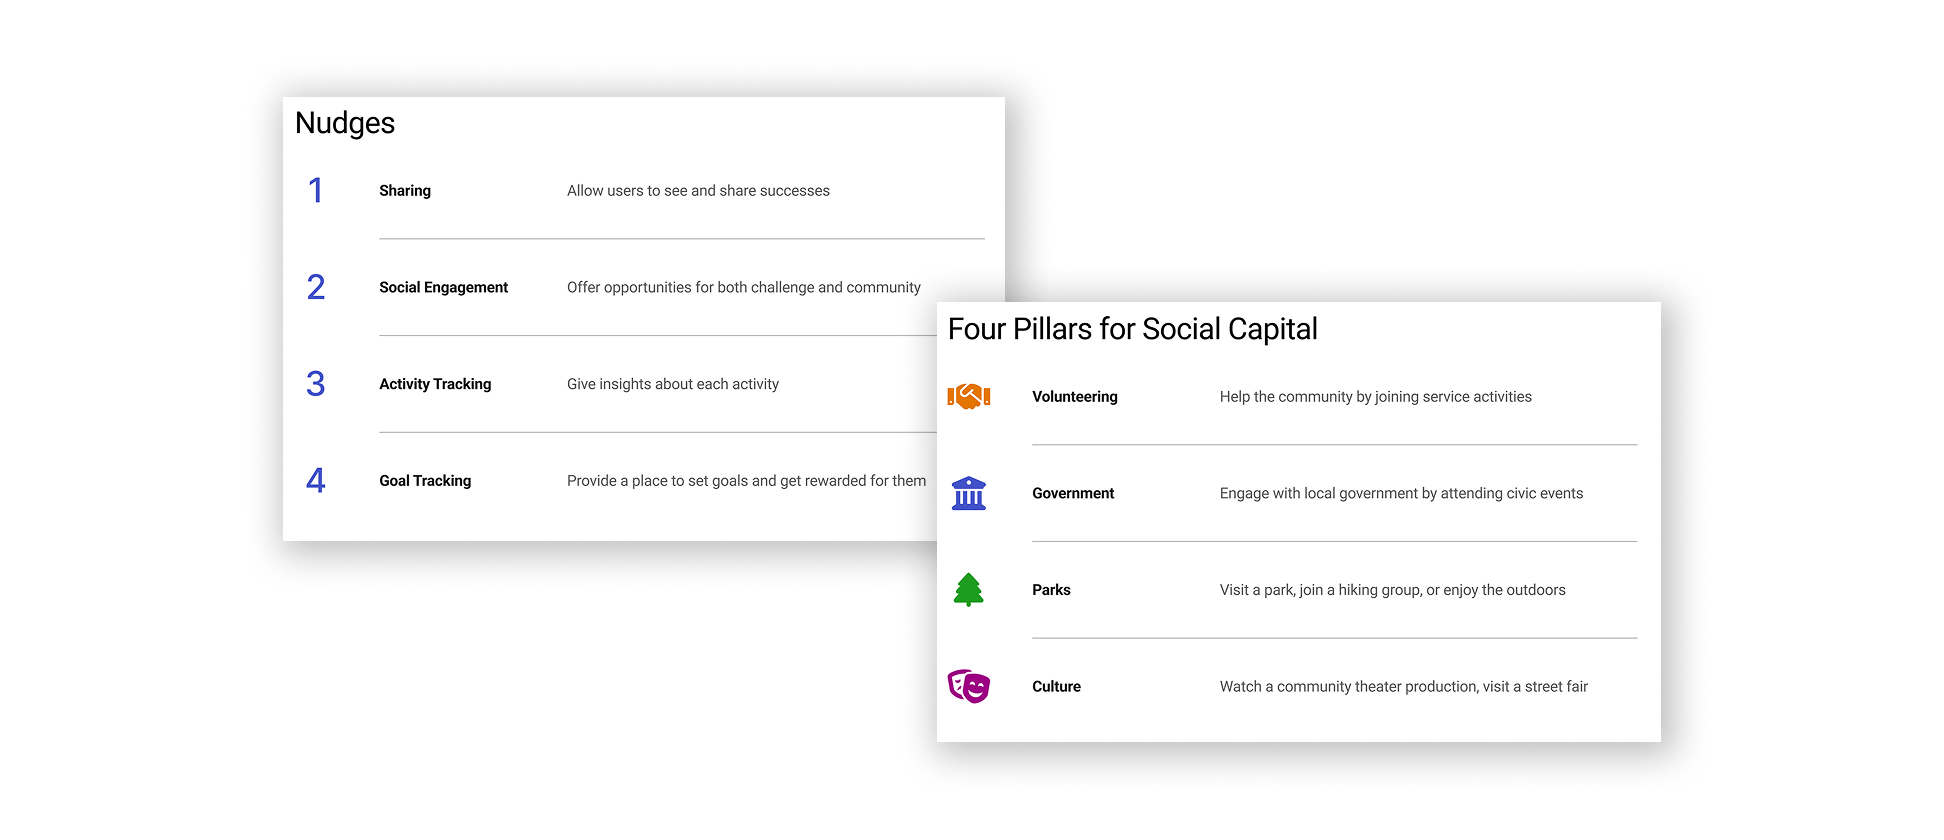
A quick summary of the framework I used for the experience.
I sketched some initial designs and ran them past my interview subjects. Most of them were received well, and they served as the basis of the high-fidelity prototyping that I did later. Some of the screens were removed as part of the iterative process. The image below shows a snapshot of early versions of what remained.

Screenshot of some early mock ups of the app experience.
By the end of the ideation process, I had a strong set of core principles and low-fidelity designs to work with. I took these elements and proceeded to build a design library and then prototype from scratch in Figma.

Results
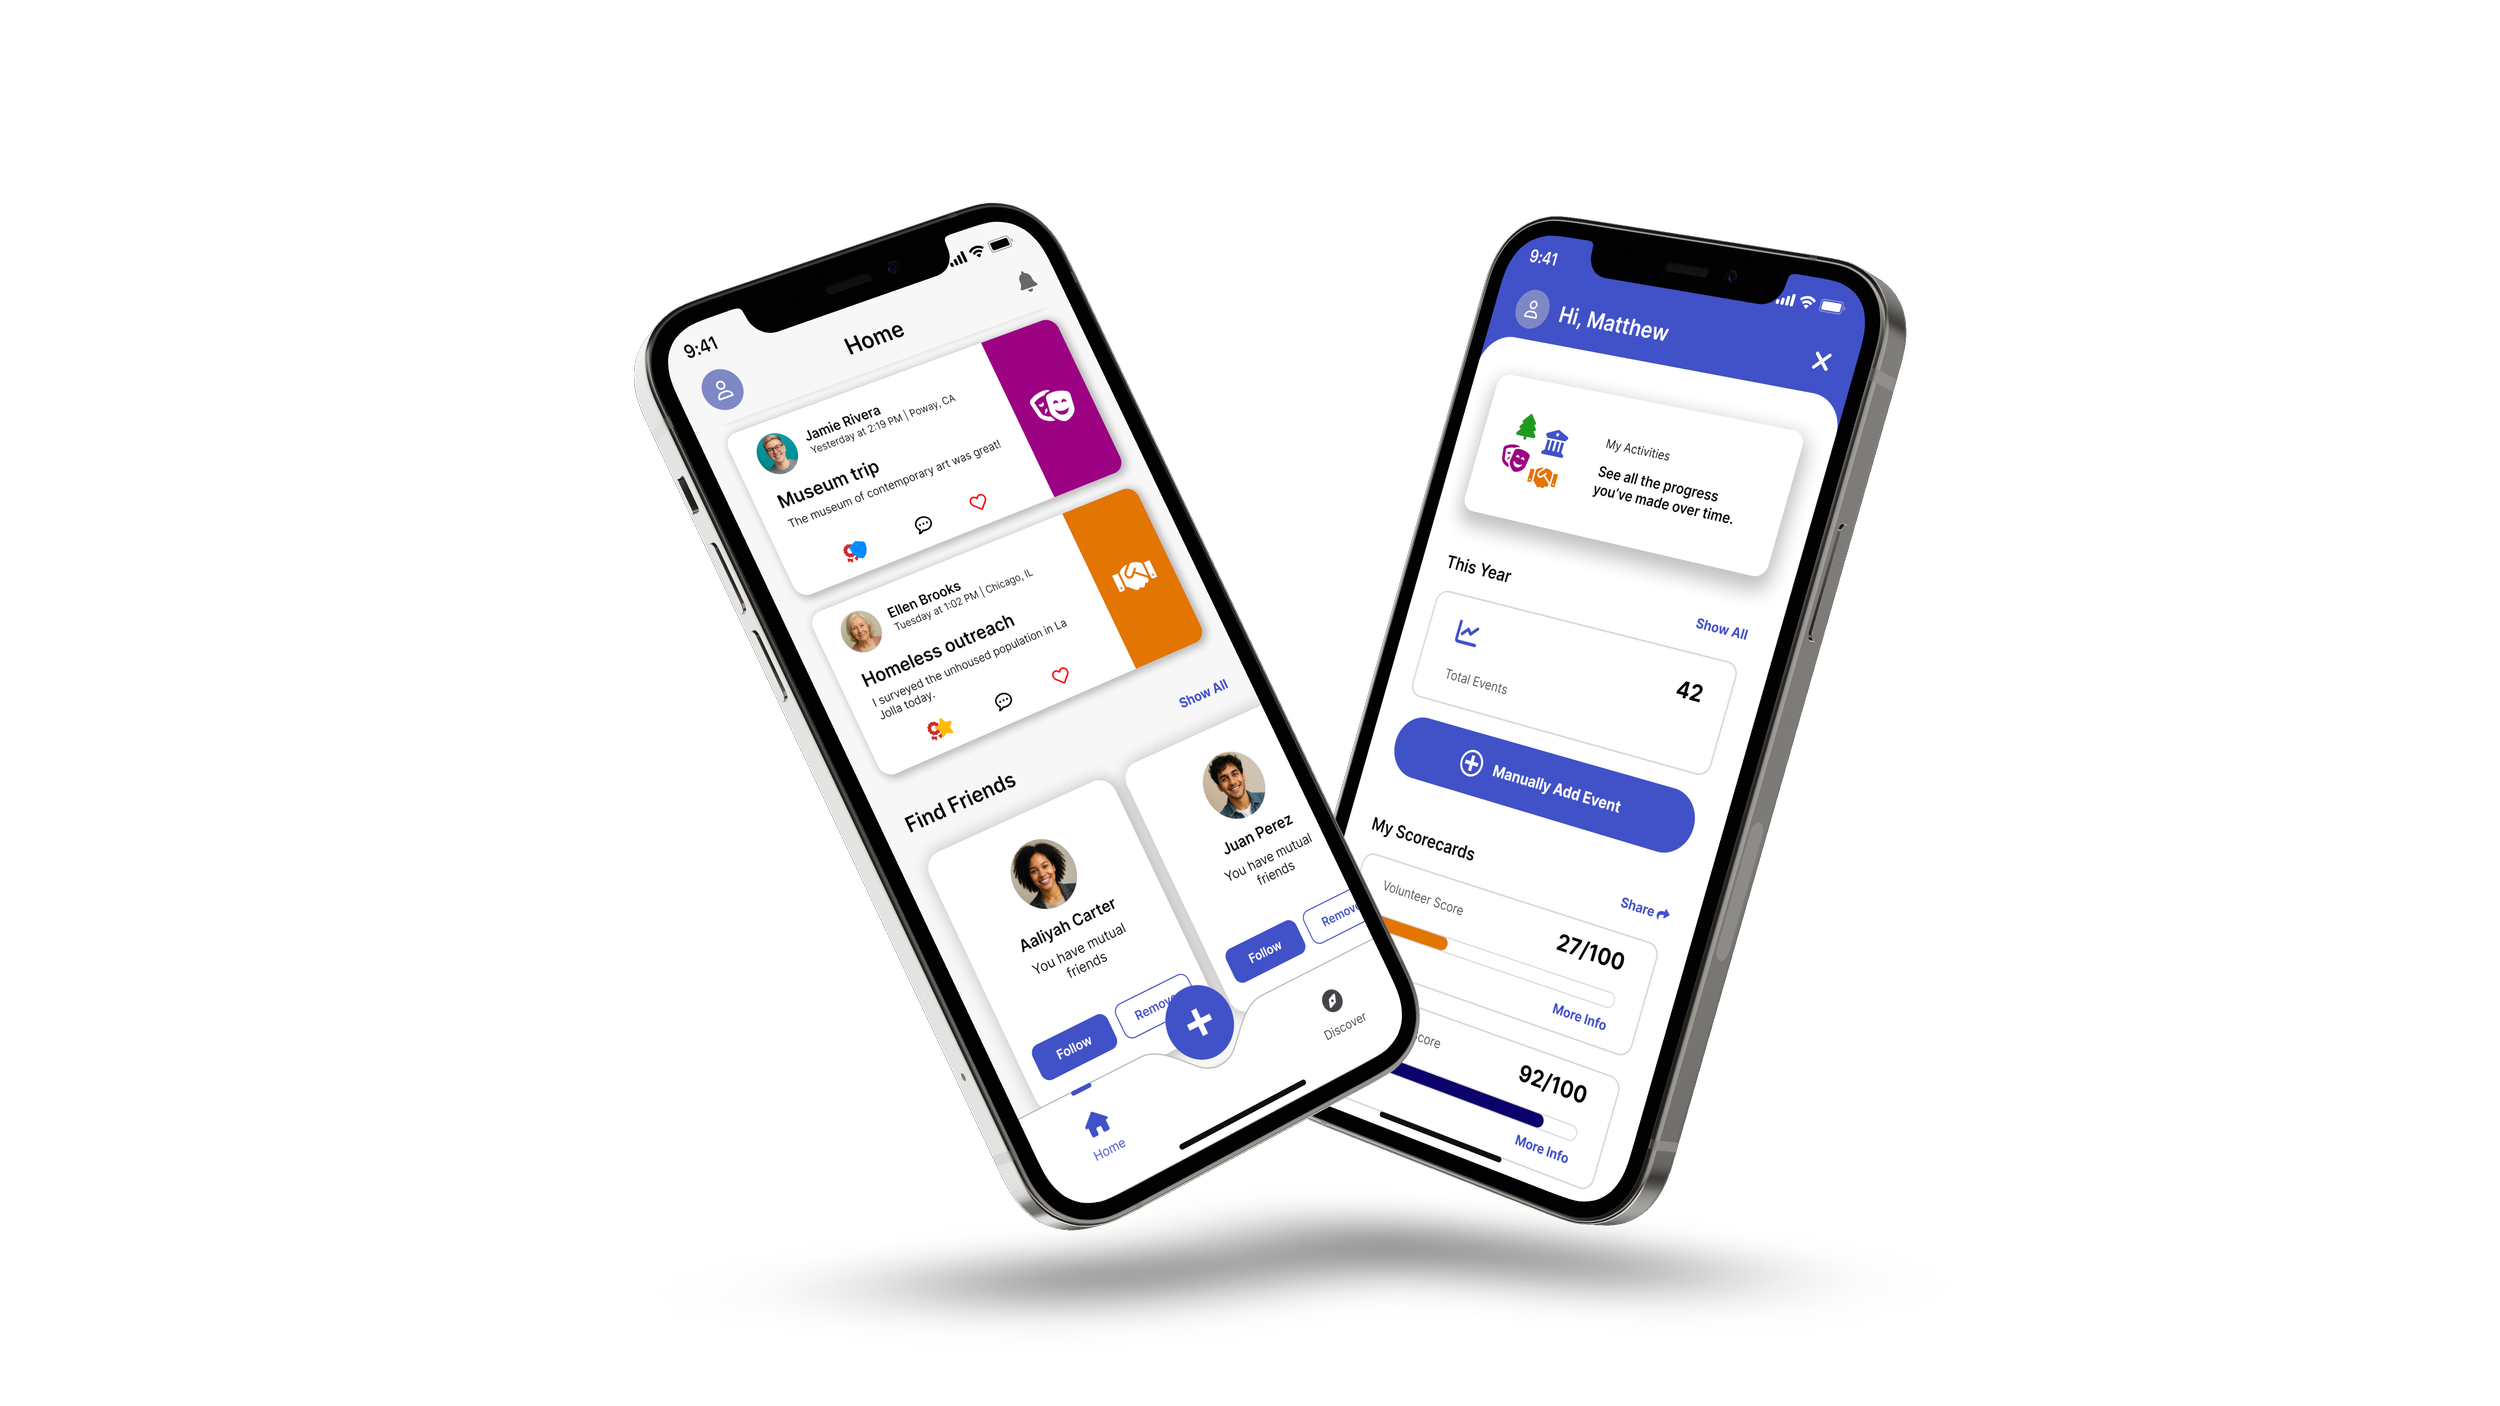
Highlighted screens from the app prototype experience. Each screen shows a different major feature.
The app contains four core components: a home feed to serve as the primary core for social posting, a discover section where users can find challenges and join groups, an area to add and track activities, and a profile section where users can track progress.
Home Feed

The home feed is the landing page for the entire app, and it takes inspiration from social media home pages, where users can see what their ‘friends’ have done in the community. My initial sketch of the design envisioned a dynamic feed of user posts that highlight the user, the activity name and location, options to like and comment, an indicator for any achievements or badges, and a tag to show what type of activity was recorded. Users can post one of four activity types: a trip to a park, a local culture activity, volunteering, or attending a government meeting. From there, users can tap any individual post to add a comment, like it, or see more information. In the more information screen, the user can see metadata, with additional information about the activity. This final, high-fidelity set of wireframes helps with both the community bridging and bonding part of the findings I made in research. Here, users can directly access their community and get encouragement from it.
Adding Activities

The ability to add an activity to the feed is another core stated goal for the app. Here, users can post an activity that they participated in and directly explain all the components of it. Overall, the ability to add an activity with details helps with bridging to the community at large in a way that offers greater transparency. People can dive into the details of any single activity and learn more about how to get started themselves.
Profile

The profile section is where users can see and track their own accomplishments within the app. This is the center of the gamification and goal-tracking portions of the experience. Users can keep track of ‘score goals’ that they set for each category of activity, on a monthly basis. Within each category, they can see a log of their activities and any awards that they have received from them. I drew heavily from fitness and wellness tracking apps, like Apple Fitness, for this portion of the user interface. I also found inspiration from apps like Goodreads, where users can track their reading progress in a summary overview. The goal here is for users to find a place where they can both track their progress and feel a sense of pride for all they have accomplished. It is rooted in established design principles and contemporary HCI paradigms.
Discover

Finally, the discover page allows users to browse experiences in their area where they can participate in the local community and civic life. It is split into two sections—a social area where users can join groups to participate in activities together and a challenges area where they can push themselves to participate to meet a joal. This portion of the app is focused on the competition aspect of gamification, which is shown to sustain ongoing participation. Similar to wellness apps, users can enter a group or a challenge that pushes them toward a shared or personal goal.
Reflection
There is much left to be done in order to create a final, development-ready prototype. If given more time, I would go to community leaders and organizations in the area and understand more about what they need in order to support a concept like this. Ideally, community members would contribute to the “discovery” section of the app by posting challenges and creating groups. Additionally, there should be broad areas where users can find the resources they need to get help. Nothing in the experience should require background knowledge on the user’s part. Though the current prototype is strong in its core areas, more detail needs to be given for subviews, flows, and error states. Additionally, a comprehensive design library with a full set of assets should be created to finalize the vision. Once these have been created, extensive user testing can be conducted. Previous research was done via interviews, but no user testing with a final prototype has yet been conducted. I had fun creating this experience. It allowed me to use skills that I rarely get to practice in my job—creating UI components and running statistical models.